From A/B to RL (3/3): MENACE and Delayed Rewards
Learning state-dependent policies with MENACE, matchboxes, and beads.
In the previous post in this series, the learner selected among actions online in a one-step bandit. It kept a posterior over each action's expected immediate reward $\theta_a$, and that uncertainty determined how often each action was chosen.
We keep the bandit's idea of choosing actions online, but add two elements of a richer RL problem: the choice now depends on the current board state, and the outcome arrives only when the game ends. In tic-tac-toe, the value of a move depends on the position and the opponent, so one global expected reward per action is no longer enough.
This is the third post in a three-part series:
- Part 1: Bayesian A/B Testing
- Part 2: Bandits and Thompson Sampling
- Part 3: MENACE and Delayed Rewards (this post)
The Toy Problem
We use tic-tac-toe as a small RL environment. One player, $X$, is the learner; the opponent plays $O$. Whenever $X$ moves, the current board is the state $s$, and choosing a legal square is an action $a$. In tic-tac-toe, we also call this action a move. The chosen action changes the board, and play continues until the game ends.
A complete game is called an episode. Rather than assigning an immediate reward to every move, we use the final win, draw, or loss as the terminal outcome $Y$. In RL terms, $Y$ is the delayed terminal feedback signal. The learner observes the board and the opponent's moves during the game, but receives this learning signal only after the episode ends. That delayed outcome is then used to update the policy for the moves selected earlier in the episode.
# Imports and setup
# Companion files keep game rules and widget code out of the narrative.
# - notebooks/from_ab_to_rl/menace_engine.py: core tic-tac-toe and MENACE training logic.
# - notebooks/from_ab_to_rl/menace_playable_app.py: interactive Bokeh widget.
import copy
import importlib.metadata
import platform
import sys
from dataclasses import dataclass
from pathlib import Path
from IPython.display import display

import matplotlib.pyplot as plt
import numpy as np
import seaborn as sns
from matplotlib.colors import to_rgb
from matplotlib.lines import Line2D
from matplotlib.patches import Circle, Rectangle


def add_blogpost_module_path() -> None:
    """Make the local MENACE helper module importable from common notebook cwd choices."""
    for candidate in (Path.cwd(), Path.cwd() / "ab2rl_blogposts", Path.cwd().parent):
        if (candidate / "menace_engine.py").exists():
            sys.path.insert(0, str(candidate))
            return
    raise FileNotFoundError("Could not find menace_engine.py")


add_blogpost_module_path()

# Import the core tic-tac-toe and MENACE learning helpers.
from menace_engine import (  # noqa: E402
    EMPTY,
    O_MARK,
    Board,
    MenaceEngine,
    OpponentPolicy,
    X,
    apply_action,
    available_actions,
    canonicalize_board,
    defensive_heuristic_policy,
    evaluate_against_opponent,
    is_terminal,
    perfect_policy,
    player_to_move,
    positional_heuristic_policy,
    random_policy,
    summarize_outcomes,
    winner,
)

sns.set_style("darkgrid")
plt.rcParams["figure.figsize"] = (7, 4)

def display_figure(fig, *, alt_text: str) -> None:
    """Display a Matplotlib figure with accessible alternative text."""
    display(fig, metadata={"alt": alt_text})
    plt.close(fig)
#
MENACE: Matchboxes and Policies
To make this setting concrete, we turn to MENACE, short for Matchbox Educable Noughts and Crosses Engine. Donald Michie built it in the early 1960s as a physical machine that learned to play tic-tac-toe. The original system used matchboxes and colored beads instead of code and arrays.
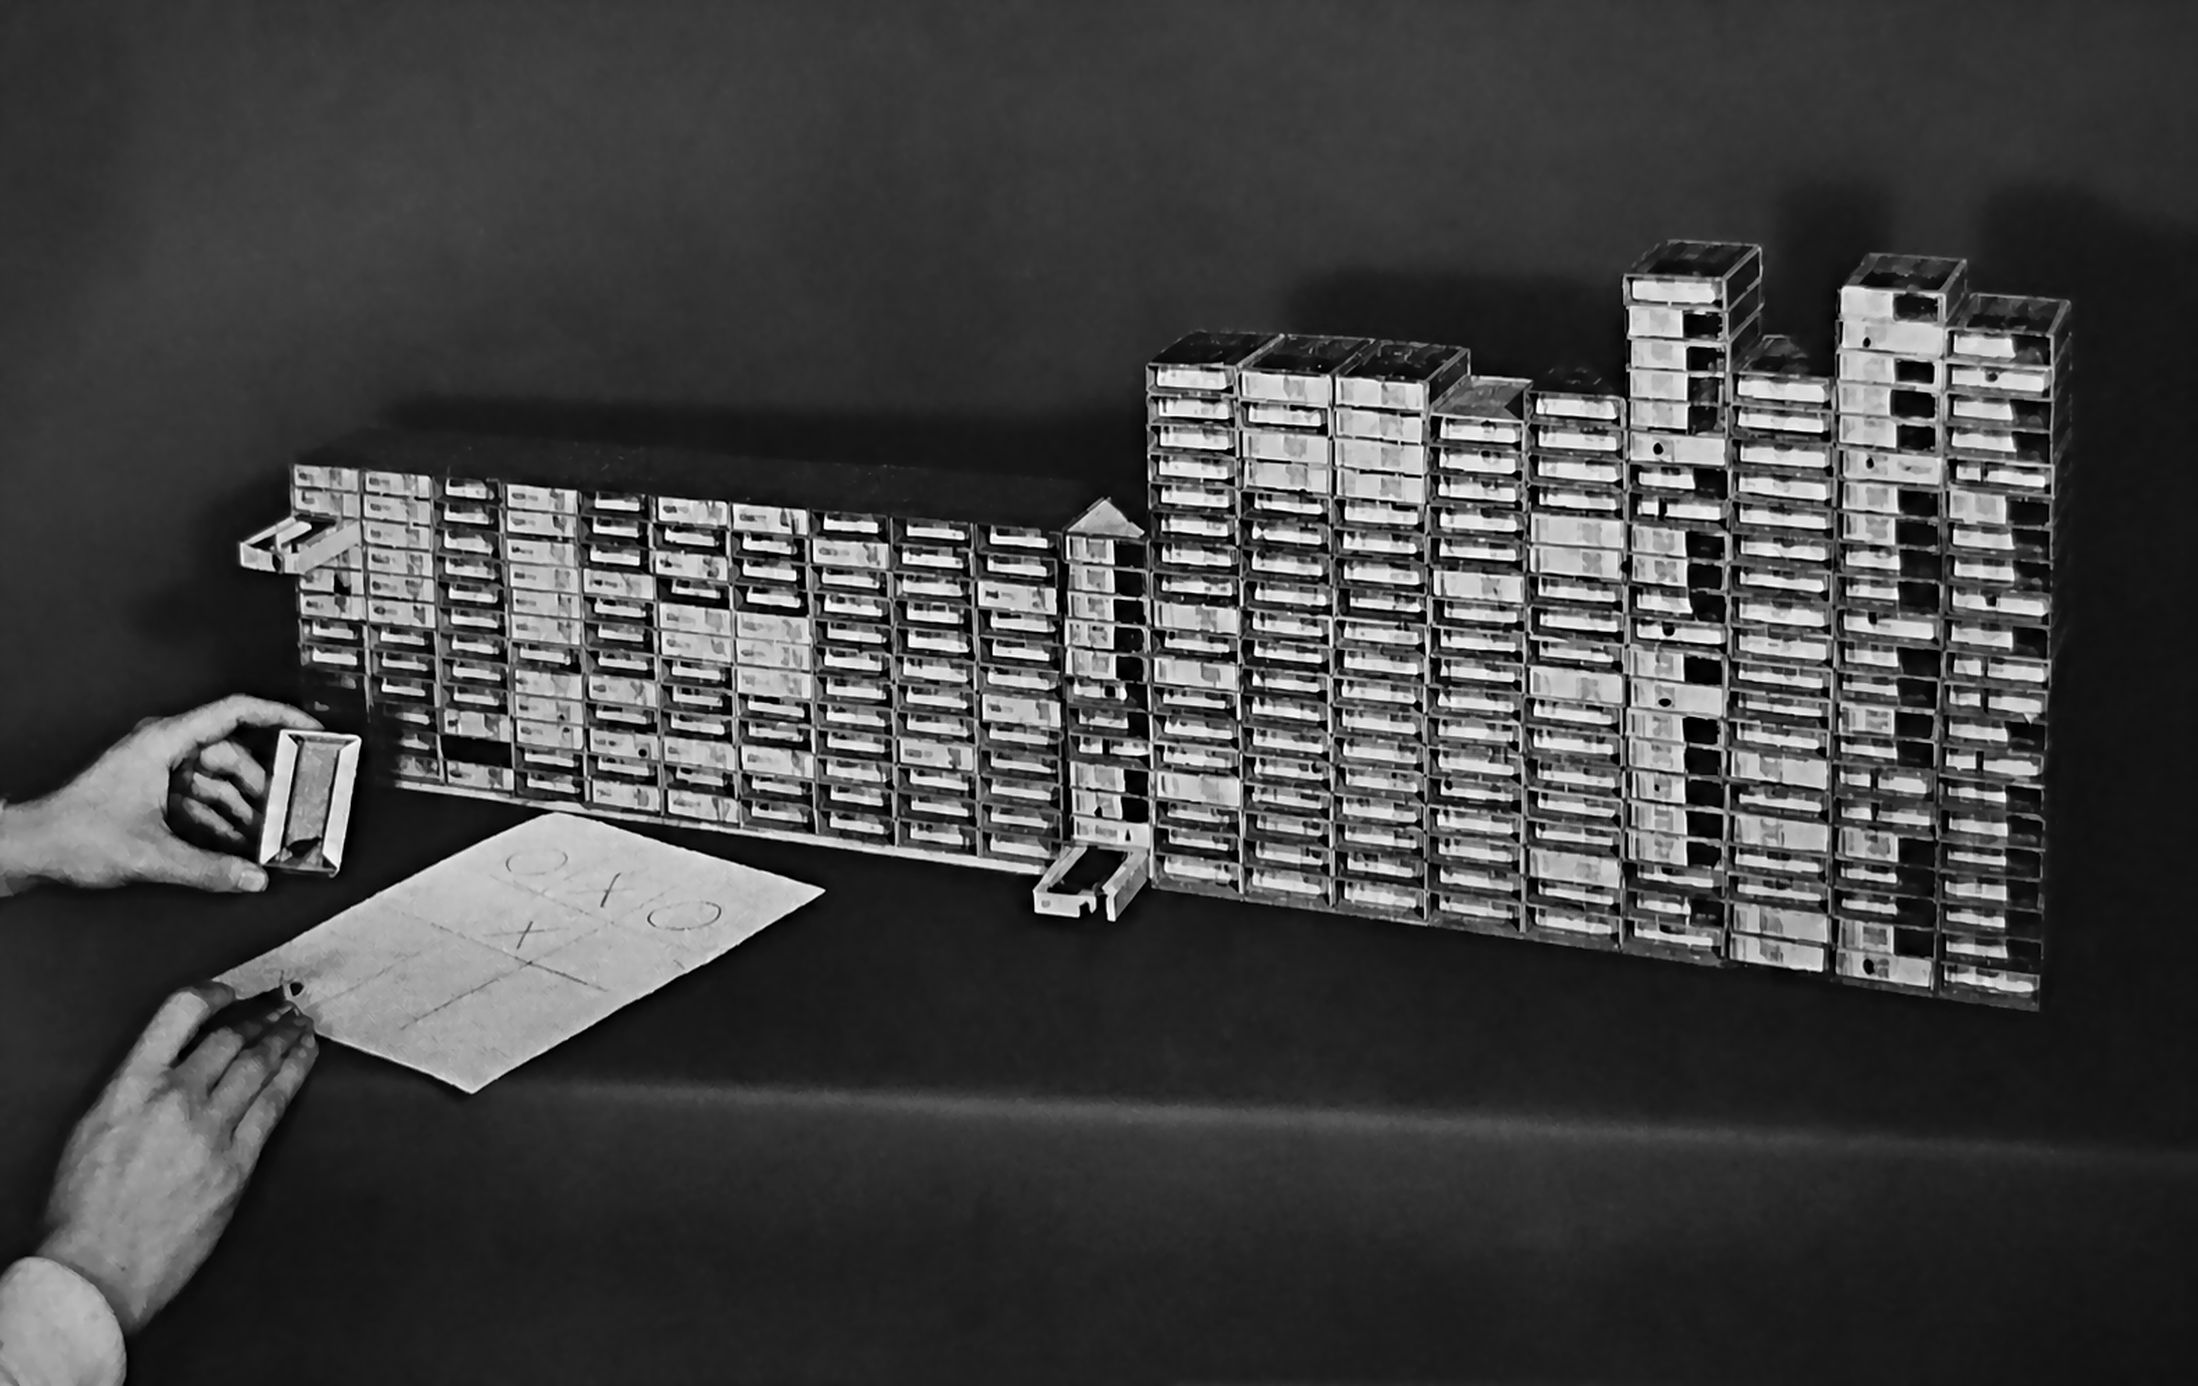
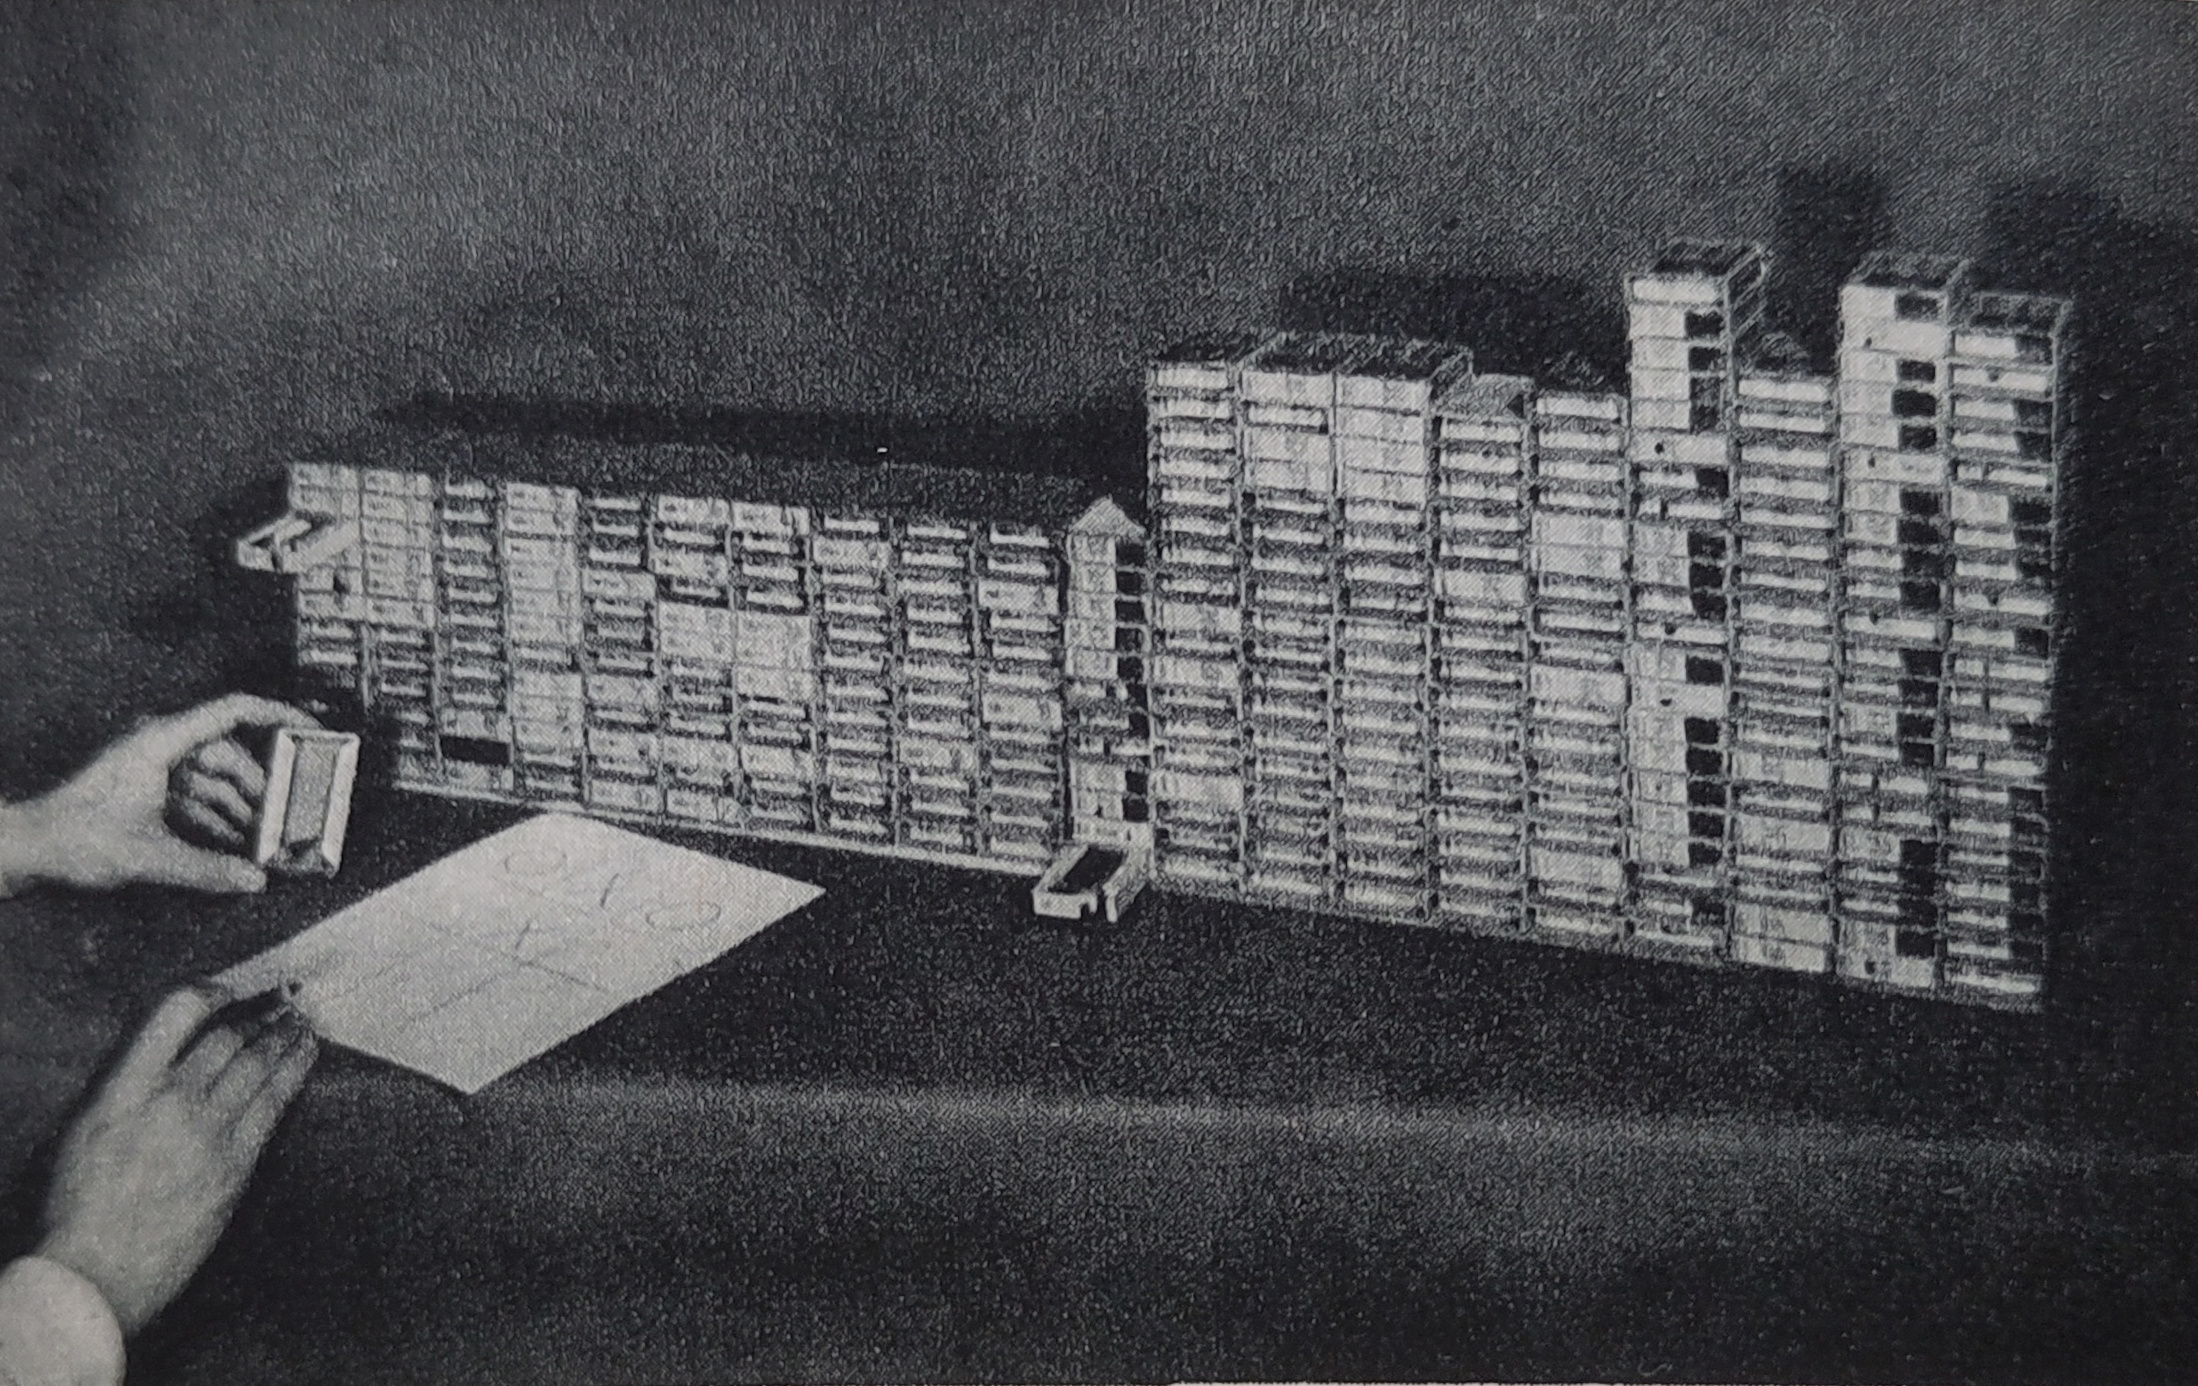
This physical setup makes MENACE a deliberately simple educational example of reinforcement learning. It extends the series from one-step bandits to state-dependent, delayed-reward learning while keeping the learning process visible.
MENACE uses a matchbox to represent each tracked board state, as shown in the photograph above and the diagram below. Symmetry-equivalent boards share a matchbox. Each bead color in that box represents a possible move. When several empty squares are equivalent under rotation or reflection, one color can represent that group of moves. Drawing a bead selects one of these moves, and MENACE maps it to a square on the current board. After the game, the final result is used to update the beads selected during play; we explain that delayed update below.
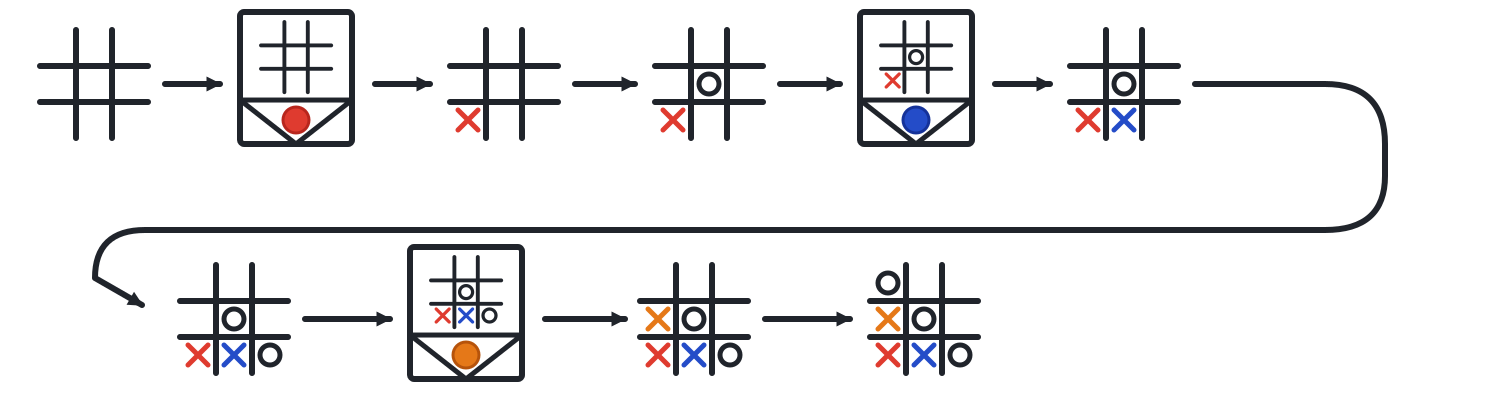
Here the policy is explicit and physical: the bead counts in each matchbox define how likely each available move is to be selected. Drawing a bead samples an action from that policy, much like drawing from a statistical urn model.
In reinforcement-learning terms, the physical setup looks like this:
- matchboxes represent tracked board states,
- bead colors represent legal moves, including groups of symmetry-equivalent moves, from those states,
- relative bead counts define the probability of each move in a state,
- the game rules and opponent produce the next board state,
- one full game is called an episode,
- only the final win/draw/loss outcome is used for learning.
Here we simulate this physical design in code.
How MENACE Selects a Move
MENACE separates action selection during a game from learning after the game ends. During an episode, it reads the current board, draws a bead from the corresponding matchbox, and plays the selected move. It records the selected beads but leaves their counts unchanged. Once the game ends, it uses the final win, draw, or loss to update those beads.
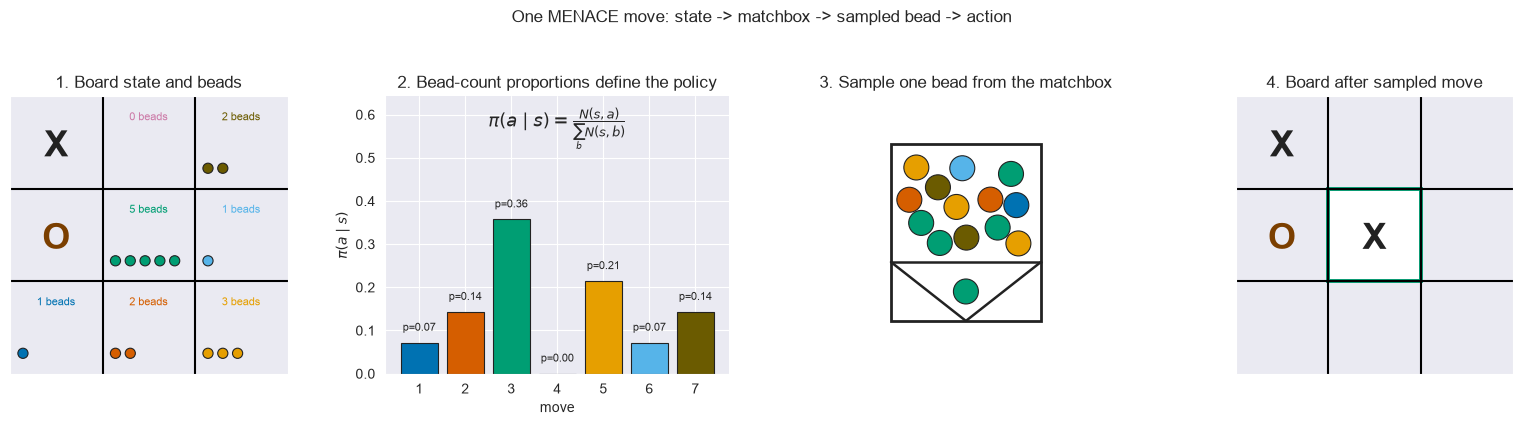
The figure below zooms in on one move. Read its four panels from left to right: the current board state, the corresponding matchbox and its bead distribution, the sampled bead that selects the move, and the resulting board. It uses a small illustrative matchbox whose bead counts are already uneven, as if earlier games had started to shape the policy.
Let $s$ denote the current board state, let $\mathcal{A}(s)$ be the set of moves represented in the matchbox for that state, and let $a \in \mathcal{A}(s)$ be one such move. MENACE observes the current board and looks up the matching matchbox. In that matchbox, $N(s,a)$ is the bead count for move $a$, so it acts as that move's policy weight. Colors are local to the box: on this board, each color marks one available move.
Inside a matchbox, the probability of selecting each move is its bead-count proportion:
$$ \pi(a \mid s) = \frac{N(s,a)}{\sum_{b \in \mathcal{A}(s)} N(s,b)}. $$
The sampled bead determines the move shown in the figure's third panel, which MENACE maps to a legal square in the final panel. This is the action-selection phase; the bead counts are updated only after the episode outcome is known.
# Define plotting helpers for boards, beads, and policy heatmaps.
MARK_TEXT = {EMPTY: "", X: "X", O_MARK: "O"}
MARK_COLORS = {X: "#222222", O_MARK: "#7b3f00"}
MOVE_CLASS_COLORS = (
    "#0072B2",  # blue
    "#D55E00",  # vermillion
    "#009E73",  # green
    "#CC79A7",  # purple
    "#E69F00",  # orange
    "#56B4E9",  # sky blue
    "#6B5B00",  # dark olive
    "#999999",  # grey
)
BEAD_EDGE_COLOR = "#222222"
EMPTY_CELL_COLOR = "#f7f7f2"
SELECTED_ACTION_FILL_COLOR = "#ffffff"


def draw_board_grid(
    ax: plt.Axes,
    board: Board,
    *,
    title: str = "",
    highlight_action: int | None = None,
    highlight_edge_color: str | None = None,
) -> None:
    """Draw a tic-tac-toe board with optional highlighted action square."""
    ax.set_xlim(0, 3)
    ax.set_ylim(3, 0)
    ax.set_aspect("equal")
    ax.set_xticks([])
    ax.set_yticks([])
    ax.set_title(title)

    for line_position in (1, 2):
        ax.axhline(line_position, color="black", linewidth=1.5)
        ax.axvline(line_position, color="black", linewidth=1.5)

    if highlight_action is not None:
        row, col = divmod(highlight_action, 3)
        ax.add_patch(
            Rectangle(
                (col, row),
                1,
                1,
                facecolor=SELECTED_ACTION_FILL_COLOR,
                edgecolor=highlight_edge_color or BEAD_EDGE_COLOR,
                linewidth=2.8,
            )
        )

    for index, value in enumerate(board):
        if value == EMPTY:
            continue
        row, col = divmod(index, 3)
        ax.text(
            col + 0.5,
            row + 0.55,
            MARK_TEXT[value],
            ha="center",
            va="center",
            fontsize=26,
            fontweight="bold",
            color=MARK_COLORS[value],
        )


def move_class_color(action_index: int) -> str:
    """Return the display color for one local MENACE move."""
    return MOVE_CLASS_COLORS[action_index % len(MOVE_CLASS_COLORS)]


def blend_with_white(color: str, amount: float) -> tuple[float, float, float]:
    """Blend a color with white so probability cells stay readable."""
    rgb = np.array(to_rgb(color))
    return tuple((1.0 - amount) * np.ones(3) + amount * rgb)


def action_class_grid(menace: MenaceEngine, board: Board) -> np.ndarray:
    """Map each physical legal square to its symmetry-distinct move class."""
    grid = np.full(9, -1, dtype=int)
    legal_actions = available_actions(board)
    if len(legal_actions) == 1:
        grid[legal_actions[0]] = 0
        return grid.reshape(3, 3)

    canonical_board, permutation = canonicalize_board(board)
    if canonical_board not in menace.boxes:
        return grid.reshape(3, 3)

    for action_index, canonical_action in enumerate(menace.matchbox_actions[canonical_board]):
        orbit = menace.matchbox_action_orbits[canonical_board][canonical_action]
        for action_in_orbit in orbit:
            original_action = permutation[action_in_orbit]
            grid[original_action] = action_index

    return grid.reshape(3, 3)


def draw_beads_in_cell(ax: plt.Axes, *, row: int, col: int, count: int, color: str) -> None:
    """Draw a compact bead stack inside one board cell."""
    max_beads_shown = 10
    nb_beads_shown = min(count, max_beads_shown)
    if count > max_beads_shown:
        # Reserve the last bead slot for an ellipsis marker.
        nb_beads_shown = max_beads_shown - 1
    for bead_index in range(nb_beads_shown):
        bead_col = bead_index % 5
        bead_row = bead_index // 5
        bead_x = col + 0.14 + 0.16 * bead_col
        bead_y = row + 0.78 - 0.16 * bead_row
        ax.add_patch(
            Circle(
                (bead_x, bead_y),
                radius=0.055,
                facecolor=color,
                edgecolor=BEAD_EDGE_COLOR,
                linewidth=0.8,
            )
        )
    if count > max_beads_shown:
        marker_index = max_beads_shown - 1
        marker_col = marker_index % 5
        marker_row = marker_index // 5
        ax.text(
            col + 0.14 + 0.16 * marker_col,
            row + 0.78 - 0.16 * marker_row - 0.005,
            "...",
            ha="center",
            va="center",
            color=color,
            fontsize=11,
            fontweight="bold",
        )
    # Large counts are shown exactly by the text label above the beads.


def draw_matchbox_beads(
    ax: plt.Axes,
    menace: MenaceEngine,
    board: Board,
    *,
    title: str = "",
    highlight_action: int | None = None,
    show_probabilities: bool = True,
) -> None:
    """Draw bead counts for the symmetry-distinct moves in one matchbox."""
    canonical_board, permutation = canonicalize_board(board)
    highlight_edge_color = None
    if highlight_action is not None and canonical_board in menace.boxes:
        inverse_permutation = tuple(np.argsort(permutation))
        canonical_highlight_action = inverse_permutation[highlight_action]
        for action_index, canonical_action in enumerate(menace.matchbox_actions[canonical_board]):
            action_orbit = menace.matchbox_action_orbits[canonical_board][canonical_action]
            if canonical_highlight_action in action_orbit:
                highlight_edge_color = move_class_color(action_index)
                break
    draw_board_grid(
        ax,
        board,
        title=title,
        highlight_action=highlight_action,
        highlight_edge_color=highlight_edge_color,
    )
    if canonical_board not in menace.boxes:
        ax.text(1.5, 1.5, "no matchbox", ha="center", va="center")
        return

    beads = menace.boxes[canonical_board]
    total_beads = beads.sum()
    for action_index, canonical_action in enumerate(menace.matchbox_actions[canonical_board]):
        original_action = permutation[canonical_action]
        row, col = divmod(original_action, 3)
        count = int(beads[action_index])
        probability = count / total_beads if total_beads else 0.0
        color = move_class_color(action_index)
        draw_beads_in_cell(ax, row=row, col=col, count=count, color=color)
        ax.text(col + 0.5, row + 0.23, f"{count} beads", ha="center", va="center", fontsize=8, color=color)
        if not show_probabilities:
            continue
        ax.text(col + 0.5, row + 0.43, f"p={probability:.2f}", ha="center", va="center", fontsize=8, color=color)


def draw_policy_heatmap(
    ax: plt.Axes,
    menace: MenaceEngine,
    board: Board,
    *,
    title: str = "",
    highlight_max: bool = False,
    spread_over_orbits: bool = True,
) -> None:
    """Draw the action probabilities induced by bead counts on the board."""
    probabilities = menace.probability_grid(board, spread_over_orbits=spread_over_orbits)
    action_classes = action_class_grid(menace, board)
    max_probability = float(probabilities.max())
    ax.imshow(np.ones((3, 3, 3)), origin="upper")
    ax.set_xticks([])
    ax.set_yticks([])
    ax.set_title(title)

    legal_actions = set(available_actions(board))
    display_actions = legal_actions
    if not spread_over_orbits and len(legal_actions) > 1:
        # Show only representative move classes, rather than every symmetric square.
        canonical_board, permutation = canonicalize_board(board)
        display_actions = {
            permutation[canonical_action]
            for canonical_action in menace.matchbox_actions[canonical_board]
        }
    best_actions: set[int] = set()
    if highlight_max:
        best_actions = {
            action
            for action in display_actions
            if probabilities.ravel()[action] == max_probability
        }
    for index, value in enumerate(board):
        row, col = divmod(index, 3)
        if value != EMPTY:
            ax.add_patch(Rectangle((col - 0.5, row - 0.5), 1, 1, facecolor=EMPTY_CELL_COLOR, edgecolor="none"))
            ax.text(
                col,
                row,
                MARK_TEXT[value],
                ha="center",
                va="center",
                fontsize=24,
                fontweight="bold",
                color=MARK_COLORS[value],
            )
            continue
        if index in display_actions:
            probability = probabilities[row, col]
            action_class = int(action_classes[row, col])
            color = move_class_color(action_class) if action_class >= 0 else "#cccccc"
            color_amount = 0.18 + 0.72 * (probability / max_probability if max_probability else 0.0)
            ax.add_patch(
                Rectangle(
                    (col - 0.5, row - 0.5),
                    1,
                    1,
                    facecolor=blend_with_white(color, color_amount),
                    edgecolor="none",
                )
            )
            if index in best_actions and max_probability > 0:
                ax.add_patch(
                    Rectangle(
                        (col - 0.48, row - 0.48),
                        0.96,
                        0.96,
                        fill=False,
                        edgecolor="#cc7a00",
                        linewidth=2.5,
                    )
                )
            ax.text(col, row, f"{probability:.2f}", ha="center", va="center", fontsize=11)

    for line_position in (0.5, 1.5):
        ax.axhline(line_position, color="black", linewidth=1.4)
        ax.axvline(line_position, color="black", linewidth=1.4)
#
# Illustrate one MENACE action as beads, policy probabilities, sampling, and board update.
untrained_menace = MenaceEngine(plays_first=True, rng=np.random.default_rng(2026052801))
opening_board: Board = (EMPTY,) * 9


def draw_sampled_bead_for_action_index(
    ax: plt.Axes,
    *,
    action_index: int,
    title: str,
    label: str,
) -> None:
    """Draw one sampled bead from a matchbox policy."""
    color = move_class_color(action_index)
    ax.set_xlim(0, 1)
    ax.set_ylim(0, 1)
    ax.set_aspect("equal")
    ax.axis("off")
    ax.set_title(title)
    ax.add_patch(
        Circle(
            (0.5, 0.62),
            radius=0.18,
            facecolor=color,
            edgecolor=BEAD_EDGE_COLOR,
            linewidth=1.4,
        )
    )
    ax.text(
        0.5,
        0.62,
        "sampled",
        ha="center",
        va="center",
        color="white",
        fontsize=9,
        fontweight="bold",
    )
    ax.text(0.5, 0.27, label, ha="center", va="center", fontsize=10)


def draw_policy_distribution_panel(
    ax: plt.Axes,
    *,
    counts: np.ndarray,
    title: str,
) -> None:
    """Draw the action probabilities implied by one matchbox's bead counts."""
    policy = counts / counts.sum()
    action_indices = np.arange(len(policy))
    colors = [move_class_color(action_index) for action_index in action_indices]
    y_limit = min(1.0, max(0.25, float(policy.max()) * 1.8))

    ax.set_title(title)
    ax.text(
        0.5,
        0.88,
        r"$\pi(a \mid s)=\frac{N(s,a)}{\sum_b N(s,b)}$",
        ha="center",
        va="center",
        fontsize=13,
        transform=ax.transAxes,
    )
    ax.bar(
        action_indices,
        policy,
        color=colors,
        edgecolor=BEAD_EDGE_COLOR,
        linewidth=0.8,
    )
    for action_index, probability in enumerate(policy):
        ax.text(
            action_index,
            probability + y_limit * 0.035,
            f"p={probability:.2f}",
            ha="center",
            va="bottom",
            fontsize=8,
        )
    ax.set_ylim(0, y_limit)
    ax.set_xlabel("move")
    ax.set_ylabel(r"$\pi(a \mid s)$")
    ax.set_xticks(action_indices)
    ax.set_xticklabels([str(action_index + 1) for action_index in action_indices])
    ax.spines["top"].set_visible(False)
    ax.spines["right"].set_visible(False)


def draw_physical_sampling_picture(
    ax: plt.Axes,
    *,
    counts: np.ndarray,
    sampled_action_index: int,
    title: str,
) -> None:
    """Draw the matchbox beads and one sampled bead in its V-shaped holder."""
    rng = np.random.default_rng(10 + sampled_action_index)
    ax.set_xlim(0, 1)
    ax.set_ylim(0, 1)
    ax.set_aspect("equal")
    ax.axis("off")
    ax.set_title(title)

    # Match the outline and compartment proportions of menace-example-game.svg.
    box_left = 0.23
    box_width = 0.54
    box_bottom = 0.19
    box_height = box_width * 132 / 112
    holder_height = box_height * 44 / 132
    interior_bottom = box_bottom + holder_height
    interior_height = box_height - holder_height
    box_center = box_left + box_width / 2

    # Count the bead in the holder once, leaving the other beads loose in the box.
    box_counts = counts.copy()
    box_counts[sampled_action_index] -= 1
    bead_action_indices = np.repeat(np.arange(len(box_counts)), box_counts.astype(int))
    rng.shuffle(bead_action_indices)

    bead_radius = 0.045
    min_distance = bead_radius * 2.08
    positions: list[tuple[float, float]] = []
    x_min = box_left + bead_radius + 0.02
    x_max = box_left + box_width - bead_radius - 0.02
    y_min = interior_bottom + bead_radius + 0.02
    y_max = interior_bottom + interior_height - bead_radius - 0.02
    # Rejection sampling keeps the shuffled beads from overlapping in the box.
    for _ in bead_action_indices:
        for _attempt in range(1_000):
            candidate = (float(rng.uniform(x_min, x_max)), float(rng.uniform(y_min, y_max)))
            if all(np.hypot(candidate[0] - x, candidate[1] - y) >= min_distance for x, y in positions):
                positions.append(candidate)
                break
        else:
            raise RuntimeError("Could not place matchbox beads without overlap.")

    # Keep the interior white so bead colors exactly match the board and policy.
    ax.add_patch(
        Rectangle(
            (box_left, box_bottom),
            box_width,
            box_height,
            facecolor="white",
            edgecolor=BEAD_EDGE_COLOR,
            linewidth=2.0,
        )
    )
    ax.plot(
        [box_left, box_left + box_width],
        [interior_bottom, interior_bottom],
        color=BEAD_EDGE_COLOR,
        linewidth=1.8,
    )
    ax.plot(
        [box_left, box_center, box_left + box_width],
        [interior_bottom, box_bottom, interior_bottom],
        color=BEAD_EDGE_COLOR,
        linewidth=1.8,
        solid_joinstyle="round",
    )

    for action_index, (bead_x, bead_y) in zip(bead_action_indices, positions, strict=True):
        ax.add_patch(
            Circle(
                (bead_x, bead_y),
                radius=bead_radius,
                facecolor=move_class_color(int(action_index)),
                edgecolor=BEAD_EDGE_COLOR,
                linewidth=0.8,
            )
        )

    # Center the sampled bead vertically in the V-shaped opening.
    sampled_bead_y = box_bottom + holder_height / 2
    ax.add_patch(
        Circle(
            (box_center, sampled_bead_y),
            radius=bead_radius,
            facecolor=move_class_color(sampled_action_index),
            edgecolor=BEAD_EDGE_COLOR,
            linewidth=0.8,
        )
    )


def matchbox_action_index_for_board_action(
    menace: MenaceEngine,
    board: Board,
    action: int,
) -> int:
    """Return the move-class index for an action on the displayed board."""
    canonical_board, permutation = canonicalize_board(board)
    inverse_permutation = tuple(np.argsort(permutation))
    canonical_action = inverse_permutation[action]

    for action_index, representative_action in enumerate(menace.matchbox_actions[canonical_board]):
        action_orbit = menace.matchbox_action_orbits[canonical_board][representative_action]
        if canonical_action in action_orbit:
            return action_index

    raise ValueError("Could not map the action to a MENACE bead.")


sampling_board: Board = (X, EMPTY, EMPTY, O_MARK, EMPTY, EMPTY, EMPTY, EMPTY, EMPTY)
sampled_action = 4  # X takes the center.
sampling_canonical_board, _ = canonicalize_board(sampling_board)
sampled_action_index = matchbox_action_index_for_board_action(
    menace=untrained_menace,
    board=sampling_board,
    action=sampled_action,
)
# Hand-picked non-uniform counts make the policy distribution visibly interesting.
sampling_counts = np.array([1, 2, 5, 0, 3, 1, 2], dtype=int)
sampling_counts[sampled_action_index] = 5
sampling_menace = copy.deepcopy(untrained_menace)
sampling_menace.boxes[sampling_canonical_board] = sampling_counts
sampling_board_after_sampled_move = apply_action(
    board=sampling_board,
    action=sampled_action,
    player_mark=untrained_menace.menace_mark,
)

fig, axes = plt.subplots(1, 4, figsize=(16, 4.0))
draw_matchbox_beads(
    axes[0],
    sampling_menace,
    sampling_board,
    title="1. Board state and beads",
    show_probabilities=False,
)
draw_policy_distribution_panel(
    axes[1],
    counts=sampling_counts,
    title="2. Bead-count proportions define the policy",
)
draw_physical_sampling_picture(
    axes[2],
    counts=sampling_counts,
    sampled_action_index=sampled_action_index,
    title="3. Sample one bead from the matchbox",
)
draw_board_grid(
    axes[3],
    sampling_board_after_sampled_move,
    title="4. Board after sampled move",
    highlight_action=sampled_action,
    highlight_edge_color=move_class_color(sampled_action_index),
)
fig.suptitle("One MENACE move: state -> matchbox -> sampled bead -> action", y=1.05)
plt.tight_layout()
display_figure(
    fig,
    alt_text="Four-panel illustration of a MENACE move: read the board state, interpret bead-count policy weights, sample the green bead into a V-shaped matchbox holder, and place the selected cross.",
)
#
Initialization
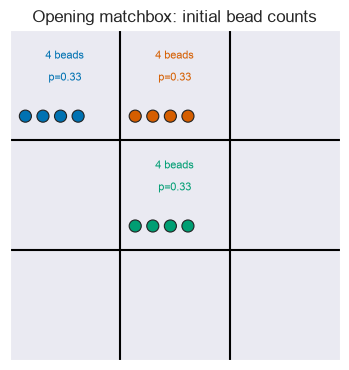
Before training, MENACE creates a matchbox for each tracked board state where it needs to choose a move. Each matchbox starts with the same number of beads for each available move. In Michie's original setup, that number depends on the move number: 4 beads for MENACE's first move, then 3, 2, and 1 for later moves. Each matchbox therefore starts with a uniform policy over its available moves. Later matchboxes start with fewer beads, so each update has a larger relative effect.
Symmetry reduces both the number of matchboxes and the number of moves they need to represent. Boards related by a rotation or reflection share one state class and one matchbox. Within a given board, empty squares that remain equivalent under a symmetry form one move class. In this post, we use move as shorthand for one of these symmetry-reduced move classes.
The empty board gives the simplest example: all four corners are equivalent, all four sides are equivalent, and the center is unique. Its opening matchbox therefore needs only three move classes: corner, side, and center. As shown in the figure below, it starts with 4 beads for each class. This is uniform over the three move classes, not over the nine physical squares. When MENACE samples a move, it maps that move back to a legal square on the current board.
# Show the initial bead counts in the opening matchbox.
fig, ax = plt.subplots(figsize=(4.2, 3.8))
draw_matchbox_beads(
    ax,
    untrained_menace,
    opening_board,
    title="Opening matchbox: initial bead counts",
)
plt.tight_layout()
display_figure(
    fig,
    alt_text="Initial bead counts in MENACE's opening matchbox before training.",
)
#
Delayed Reinforcement
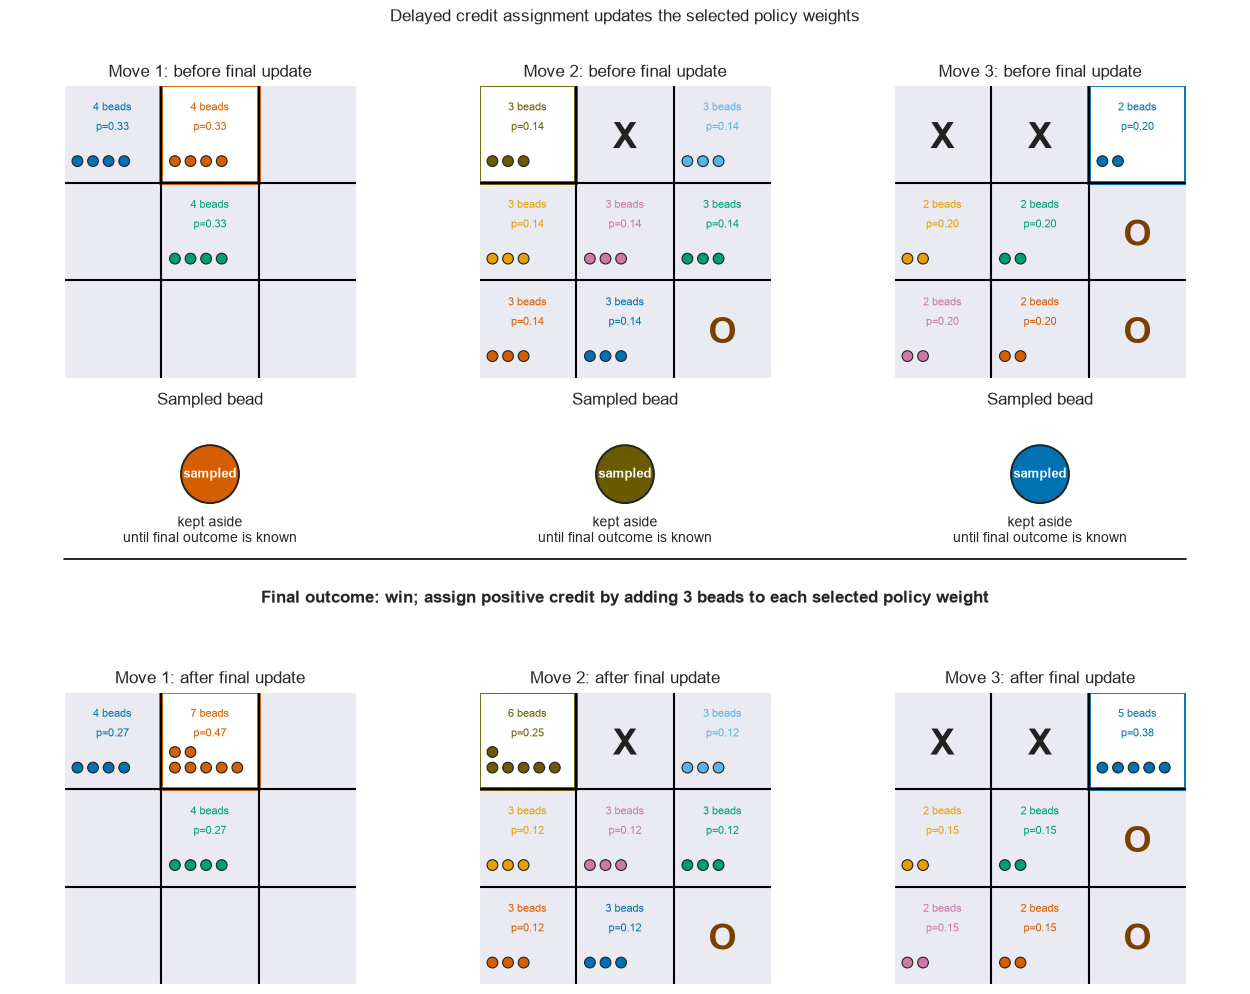
During an episode, MENACE records each state–action pair (the current board state and the move it chooses) but leaves the matchboxes unchanged. Once the game ends, the final outcome determines how every recorded move is updated.
MENACE applies the same update to the bead color selected at each visited state:
- win: add 3 beads
- draw: add 1 bead
- loss: remove 1 bead
Let $Y$ denote the final outcome. For every state–action pair $(s_t,a_t)$ selected by MENACE during the episode, the policy weight is updated as:
$$ N(s_t,a_t) \leftarrow \max(0, N(s_t,a_t) + \Delta(Y)), $$
Here, $\Delta(Y)$ is $+3$ for a win, $+1$ for a draw, and $-1$ for a loss. A positive update makes the selected move more likely in that state next time; a negative update makes it less likely. These update values are part of MENACE's design, not quantities learned from the environment.
At the end of each episode, the procedure is:
- play the game while recording each state–action pair selected by MENACE,
- observe the final outcome $Y$,
- update every recorded policy weight by $\Delta(Y)$.
This is delayed credit assignment made physical: the final outcome changes the bead counts for decisions made earlier in the game.
# Record one MENACE episode so we can visualize before/after bead updates.
@dataclass(frozen=True)
class MenaceMoveSnapshot:
    """Bead counts around one selected MENACE move in an episode."""

    board: Board
    action: int
    canonical_board: Board
    action_index: int
    counts_before: np.ndarray
    counts_after: np.ndarray


@dataclass(frozen=True)
class RecordedMenaceEpisode:
    """A played episode with enough information to visualize the bead update."""

    outcome: int
    final_board: Board
    moves: list[MenaceMoveSnapshot]


def play_recorded_game_against_opponent(
    menace: MenaceEngine,
    opponent_policy: OpponentPolicy,
    *,
    rng: np.random.Generator,
) -> RecordedMenaceEpisode:
    """Play one learning game and keep before/after bead counts for MENACE moves."""
    board: Board = (EMPTY,) * 9
    menace.reset_episode()
    # Store pre-update counts; post-update counts are filled in after the final outcome.
    provisional_moves: list[tuple[Board, int, Board, int, np.ndarray]] = []

    while True:
        if player_to_move(board) == menace.menace_mark:
            history_length = len(menace.episode_history)
            action = menace.choose_action(board, record_history=True)
            if action is None:
                outcome = -1
                break
            if len(menace.episode_history) > history_length:
                canonical_board, action_index = menace.episode_history[-1]
                provisional_moves.append(
                    (board, action, canonical_board, action_index, menace.boxes[canonical_board].copy())
                )
            board = apply_action(board=board, action=action, player_mark=menace.menace_mark)
        else:
            opponent_action = opponent_policy(board, menace.opponent_mark, rng)
            board = apply_action(board=board, action=opponent_action, player_mark=menace.opponent_mark)

        if is_terminal(board):
            winning_player = winner(board)
            if winning_player == menace.menace_mark:
                outcome = 1
            elif winning_player == menace.opponent_mark:
                outcome = -1
            else:
                outcome = 0
            break

    menace.reinforce(outcome)
    moves = [
        MenaceMoveSnapshot(
            board=move_board,
            action=action,
            canonical_board=canonical_board,
            action_index=action_index,
            counts_before=counts_before,
            counts_after=menace.boxes[canonical_board].copy(),
        )
        for move_board, action, canonical_board, action_index, counts_before in provisional_moves
    ]
    return RecordedMenaceEpisode(outcome=outcome, final_board=board, moves=moves)


def outcome_name(outcome: int) -> str:
    """Return a compact name for a MENACE outcome label."""
    return {1: "win", 0: "draw", -1: "loss"}[outcome]
#
The figure below makes this delayed update concrete. It follows three MENACE moves from one episode: the opponent's intervening moves appear as changes in the board states, the top row shows the matchboxes before updating, the middle row shows the selected beads held aside, and the bottom row shows the same matchboxes after the final outcome has been applied.
# Visualize how one final outcome updates the beads selected during an episode.
demo_menace = MenaceEngine(plays_first=True, rng=np.random.default_rng(1))
demo_episode = play_recorded_game_against_opponent(
    menace=demo_menace,
    opponent_policy=random_policy,
    rng=np.random.default_rng(1001),
)

print(f"Demo episode outcome for MENACE: {outcome_name(demo_episode.outcome)}")
print(f"Number of MENACE matchboxes updated: {len(demo_episode.moves)}")


def draw_snapshot_counts(
    ax: plt.Axes,
    snapshot: MenaceMoveSnapshot,
    *,
    counts: np.ndarray,
    title: str,
) -> None:
    """Draw one matchbox state using temporary bead counts."""
    temporary_menace = MenaceEngine(plays_first=True, rng=np.random.default_rng(0))
    temporary_menace.boxes[snapshot.canonical_board] = counts.copy()
    draw_matchbox_beads(
        ax,
        temporary_menace,
        snapshot.board,
        title=title,
        highlight_action=snapshot.action,
    )


moves_to_show = demo_episode.moves[:3]
fig, axes = plt.subplots(
    4,
    len(moves_to_show),
    figsize=(4.2 * len(moves_to_show), 9.8),
    gridspec_kw={"height_ratios": [1.0, 0.55, 0.16, 1.0]},
)
if len(moves_to_show) == 1:
    axes = axes.reshape(4, 1)

for separator_ax in axes[2, :]:
    separator_ax.axis("off")

for column_index, snapshot in enumerate(moves_to_show):
    draw_snapshot_counts(
        axes[0, column_index],
        snapshot,
        counts=snapshot.counts_before,
        title=f"Move {column_index + 1}: before final update",
    )
    draw_sampled_bead_for_action_index(
        axes[1, column_index],
        action_index=snapshot.action_index,
        title="Sampled bead",
        label="kept aside\nuntil final outcome is known",
    )
    draw_snapshot_counts(
        axes[3, column_index],
        snapshot,
        counts=snapshot.counts_after,
        title=f"Move {column_index + 1}: after final update",
    )

first_selected_move = moves_to_show[0]
final_update = int(
    first_selected_move.counts_after[first_selected_move.action_index]
    - first_selected_move.counts_before[first_selected_move.action_index]
)
bead_word = "bead" if abs(final_update) == 1 else "beads"
if final_update > 0:
    update_phrase = f"assign positive credit by adding {final_update} {bead_word} to each selected policy weight"
elif final_update < 0:
    update_phrase = f"assign blame by removing {abs(final_update)} {bead_word} from each selected policy weight"
else:
    update_phrase = "leave each selected policy weight unchanged"

fig.suptitle("Delayed credit assignment updates the selected policy weights", y=1.01)
plt.tight_layout()

sampled_row_bottom = axes[1, 0].get_position().y0
separator_y = sampled_row_bottom + 0.015
separator_x_start = min(ax.get_position().x0 for ax in axes[0, :])
separator_x_end = max(ax.get_position().x1 for ax in axes[0, :])
fig.add_artist(
    Line2D(
        [separator_x_start, separator_x_end],
        [separator_y, separator_y],
        color="black",
        linewidth=1.2,
        transform=fig.transFigure,
    )
)
fig.text(
    x=(separator_x_start + separator_x_end) / 2,
    y=sampled_row_bottom - 0.025,
    s=f"Final outcome: {outcome_name(demo_episode.outcome)}; {update_phrase}",
    ha="center",
    va="center",
    fontsize=12,
    fontweight="bold",
)
display_figure(
    fig,
    alt_text="Sequence of three MENACE moves showing matchbox weights before play, sampled beads held aside, the episode outcome, and weights after delayed credit assignment.",
)
#
The terminal outcome is not available until the whole game has been played. MENACE does not know exactly how each move influenced the final result, so it applies the same win/draw/loss update to every selected bead from that episode.
This differs from the Bayesian updates used in the first post and carried online into the second post. There, counts represented evidence about uncertain rewards or values. Here, bead counts are policy weights: MENACE adds or removes beads to make selected moves more or less likely after delayed feedback.
Learning from Self-Play
Next, we train an opening-player MENACE through repeated games. It plays 5,000 games against a small rotating pool of second-player MENACE agents, with occasional random move perturbations. This is a small self-play setup.
We then evaluate the learned opening-player policy against four fixed opponent policies: random, positional, defensive, and a perfect minimax policy. This keeps the training setup separate from the final evaluation.
We'll inspect a few checkpoints:
- 25 games: early bead movement; wins and losses begin to reshape the opening policy,
- 100 games: early policy shaping; common mistakes are being punished, but the policy is not reliable yet,
- 1,000 games: tactical matchboxes have usually been visited often enough to show clearer preferences,
- 5,000 games: in this demonstration run, the learned policy mostly draws rather than loses against perfect play.
Michie's original report tracked cumulative bonus and forfeit scores. Here we plot cumulative outcome rates instead, because they connect directly to the win/draw/loss evaluations below.
# Train MENACE with clean opening moves and noisy pooled opponents.
def record_external_action_for_menace(menace: MenaceEngine, board: Board, action: int) -> None:
    """Record an externally chosen move so MENACE can reinforce it later."""
    if len(available_actions(board)) <= 1:
        return

    canonical_board, permutation = canonicalize_board(board)
    inverse_permutation = tuple(np.argsort(permutation))
    canonical_action = inverse_permutation[action]

    for action_index, representative_action in enumerate(menace.matchbox_actions[canonical_board]):
        action_orbit = menace.matchbox_action_orbits[canonical_board][representative_action]
        if canonical_action in action_orbit:
            menace.episode_history.append((canonical_board, action_index))
            return

    raise ValueError("Could not map the action to a MENACE bead.")


def choose_noisy_opponent_action(
    menace: MenaceEngine,
    board: Board,
    *,
    random_move_probability: float,
    rng: np.random.Generator,
) -> int | None:
    """Choose an opponent move, occasionally perturbing it with a random legal move."""
    if rng.random() >= random_move_probability:
        return menace.choose_action(board, record_history=True)

    action = int(rng.choice(available_actions(board)))
    record_external_action_for_menace(menace=menace, board=board, action=action)
    return action


def play_noisy_self_play_game(
    opening_menace: MenaceEngine,
    reply_menace: MenaceEngine,
    *,
    opponent_random_move_probability: float,
    rng: np.random.Generator,
) -> tuple[int, int]:
    """Play one training game with clean opening moves and noisy reply opponents."""
    board: Board = (EMPTY,) * 9
    opening_menace.reset_episode()
    reply_menace.reset_episode()

    while True:
        if player_to_move(board) == opening_menace.menace_mark:
            action = opening_menace.choose_action(board, record_history=True)
            if action is None:
                opening_outcome, reply_outcome = -1, 1
                break
            board = apply_action(board=board, action=action, player_mark=opening_menace.menace_mark)
        else:
            action = choose_noisy_opponent_action(
                menace=reply_menace,
                board=board,
                random_move_probability=opponent_random_move_probability,
                rng=rng,
            )
            if action is None:
                opening_outcome, reply_outcome = 1, -1
                break
            board = apply_action(board=board, action=action, player_mark=reply_menace.menace_mark)

        if is_terminal(board):
            winning_player = winner(board)
            if winning_player == opening_menace.menace_mark:
                opening_outcome, reply_outcome = 1, -1
            elif winning_player == reply_menace.menace_mark:
                opening_outcome, reply_outcome = -1, 1
            else:
                opening_outcome, reply_outcome = 0, 0
            break

    opening_menace.reinforce(opening_outcome)
    reply_menace.reinforce(reply_outcome)
    return opening_outcome, reply_outcome


@dataclass(frozen=True)
class TrainingStage:
    """A named training checkpoint used for staged visualizations."""

    games: int
    label: str
    description: str


training_stages = [
    TrainingStage(games=25, label="25 games", description="early bead movement"),
    TrainingStage(games=100, label="100 games", description="early policy shaping"),
    TrainingStage(games=1_000, label="1,000 games", description="clearer tactical preferences"),
    TrainingStage(games=5_000, label="5,000 games", description="stable strong-opponent draws"),
]
stage_checkpoints = [stage.games for stage in training_stages]

training_menace = MenaceEngine(plays_first=True, rng=np.random.default_rng(2026052802))
reply_menaces = [
    MenaceEngine(plays_first=False, rng=np.random.default_rng(2026052810 + index))
    for index in range(3)
]
training_rng = np.random.default_rng(2026052803)
n_training_games = stage_checkpoints[-1]
opponent_random_move_probability = 0.05
training_outcomes: list[int] = []
menace_checkpoints: dict[int, MenaceEngine] = {0: copy.deepcopy(training_menace)}

# Checkpoints let the later figures compare early and late policy behavior.
for episode in range(1, n_training_games + 1):
    reply_menace = reply_menaces[(episode - 1) % len(reply_menaces)]
    opening_outcome, _ = play_noisy_self_play_game(
        opening_menace=training_menace,
        reply_menace=reply_menace,
        opponent_random_move_probability=opponent_random_move_probability,
        rng=training_rng,
    )
    training_outcomes.append(opening_outcome)
    if episode in stage_checkpoints:
        menace_checkpoints[episode] = copy.deepcopy(training_menace)

perfect_stage_evaluations = {
    stage.games: evaluate_against_opponent(
        menace=menace_checkpoints[stage.games],
        opponent_policy=perfect_policy,
        n_games=1_000,
        seed=500 + stage.games,
    )
    for stage in training_stages
}

evaluation_results = {
    "Random": evaluate_against_opponent(menace=training_menace, opponent_policy=random_policy, n_games=1_000, seed=401),
    "Positional": evaluate_against_opponent(
        menace=training_menace,
        opponent_policy=positional_heuristic_policy,
        n_games=1_000,
        seed=402,
    ),
    "Defensive": evaluate_against_opponent(
        menace=training_menace,
        opponent_policy=defensive_heuristic_policy,
        n_games=1_000,
        seed=403,
    ),
    "Perfect": evaluate_against_opponent(
        menace=training_menace,
        opponent_policy=perfect_policy,
        n_games=1_000,
        seed=404,
    ),
}

print(f"Training setup: pooled self-play with {opponent_random_move_probability:.0%} opponent random moves")
print("Training outcome rates:", summarize_outcomes(training_outcomes))
print("Perfect-opponent draw rates by checkpoint:")
for stage in training_stages:
    result = perfect_stage_evaluations[stage.games]
    print(f"{stage.label:>10}: draw={result['draw']:.3f}, loss={result['loss']:.3f}")
for opponent_name, result in evaluation_results.items():
    print(f"{opponent_name:>10}: win={result['win']:.3f}, draw={result['draw']:.3f}, loss={result['loss']:.3f}")
#
# Plot training outcome rates and fixed-opponent evaluations.
def cumulative_outcome_rates(outcomes: list[int]) -> dict[str, np.ndarray]:
    """Return cumulative win/draw/loss rates after each training game."""
    outcome_array = np.array(outcomes, dtype=int)
    games_seen = np.arange(1, len(outcome_array) + 1)
    return {
        "win": np.cumsum(outcome_array == 1) / games_seen,
        "draw": np.cumsum(outcome_array == 0) / games_seen,
        "loss": np.cumsum(outcome_array == -1) / games_seen,
    }


cumulative_rates = cumulative_outcome_rates(training_outcomes)
outcome_styles = (
    ("win", "win rate", "tab:green"),
    ("draw", "draw rate", "tab:blue"),
    ("loss", "loss rate", "tab:red"),
)

log_game_ticks = np.array([1, 2, 5, 10, 25, 50, 100, 250, 500, 1_000, 2_500, 5_000])

fig, axes = plt.subplots(len(training_stages), 1, figsize=(9, 10), sharey=True)
for ax, stage in zip(axes, training_stages, strict=True):
    stage_games = np.arange(1, stage.games + 1)
    for outcome_label, display_label, color in outcome_styles:
        ax.plot(
            stage_games,
            cumulative_rates[outcome_label][: stage.games],
            label=display_label,
            color=color,
            linewidth=2,
        )
    stage_ticks = log_game_ticks[log_game_ticks <= stage.games]
    if stage_ticks[-1] != stage.games:
        stage_ticks = np.append(stage_ticks, stage.games)

    ax.set_xscale("log")
    ax.set_xlim(1, stage.games)
    ax.set_xticks(stage_ticks)
    ax.set_xticklabels([f"{tick:,}" for tick in stage_ticks])
    ax.set_ylim(0.0, 1.0)
    ax.set_title(f"Up to {stage.label}: {stage.description}")
    ax.set_ylabel("cumulative rate")

axes[0].legend(frameon=False, loc="upper right")
axes[-1].set_xlabel("training game (log scale)")
fig.suptitle("Cumulative training outcome rates at different stages", y=1.01)
plt.tight_layout()
display_figure(
    fig,
    alt_text="Cumulative win, draw, and loss rates during MENACE self-play at several training stages.",
)

fig, axes = plt.subplots(1, 2, figsize=(14, 4.5))

stage_positions = np.arange(len(training_stages))
stage_labels = [stage.label for stage in training_stages]
axes[0].plot(
    stage_positions,
    [perfect_stage_evaluations[stage.games]["draw"] for stage in training_stages],
    marker="o",
    linewidth=2,
    label="draw",
    color="tab:blue",
)
axes[0].plot(
    stage_positions,
    [perfect_stage_evaluations[stage.games]["loss"] for stage in training_stages],
    marker="o",
    linewidth=2,
    label="loss",
    color="tab:red",
)
axes[0].set_xticks(stage_positions, stage_labels, rotation=20)
axes[0].set_ylim(0.0, 1.0)
axes[0].set_title("Evaluation against perfect opponent by stage")
axes[0].set_xlabel("training checkpoint")
axes[0].set_ylabel("outcome fraction")
axes[0].legend(frameon=False)

opponent_names = list(evaluation_results)
bottom = np.zeros(len(opponent_names))
for outcome_label, _, color in outcome_styles:
    values = np.array([evaluation_results[name][outcome_label] for name in opponent_names])
    axes[1].bar(opponent_names, values, bottom=bottom, color=color, label=outcome_label)
    bottom += values
axes[1].set_ylim(0.0, 1.0)
axes[1].set_title("Final evaluation after 5,000 training games")
axes[1].set_xlabel("opponent policy")
axes[1].set_ylabel("outcome fraction")
axes[1].legend(
    frameon=True,
    framealpha=0.95,
    loc="lower right",
    title="outcome",
)

plt.tight_layout()
display_figure(
    fig,
    alt_text="Two-panel evaluation of MENACE after training: draw and loss rates against a perfect opponent across checkpoints, and final outcome fractions against fixed opponents.",
)
#
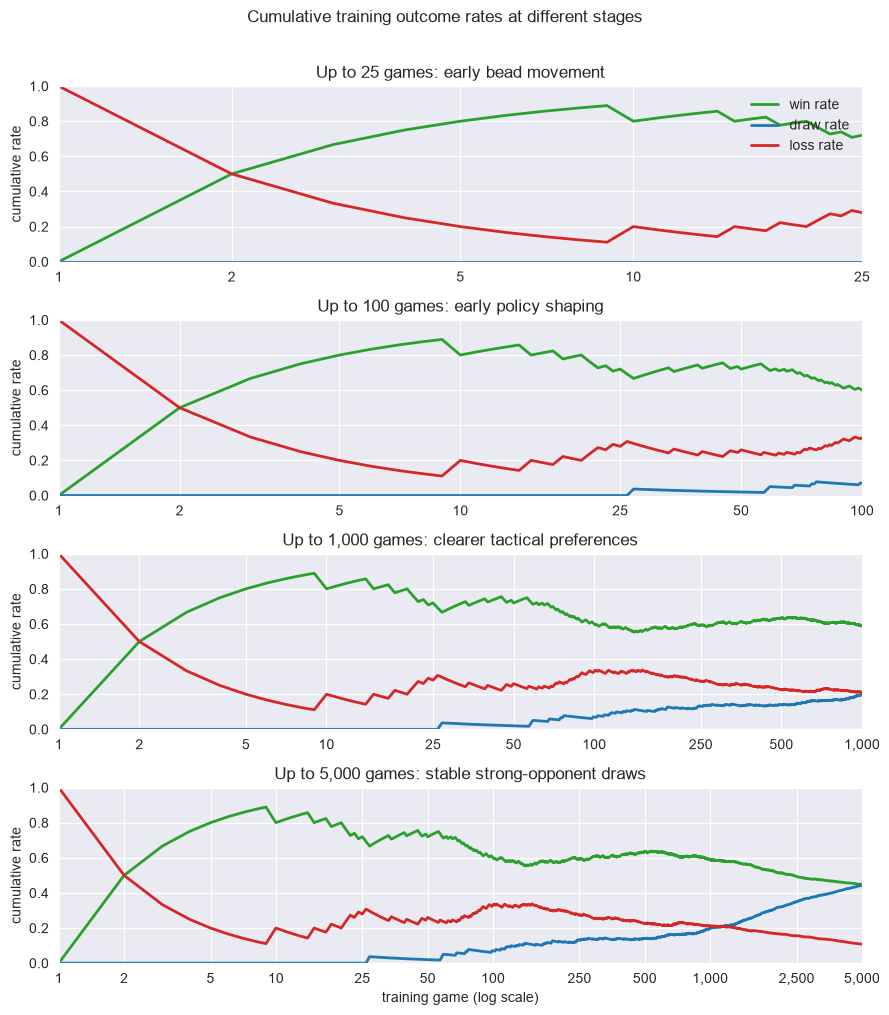
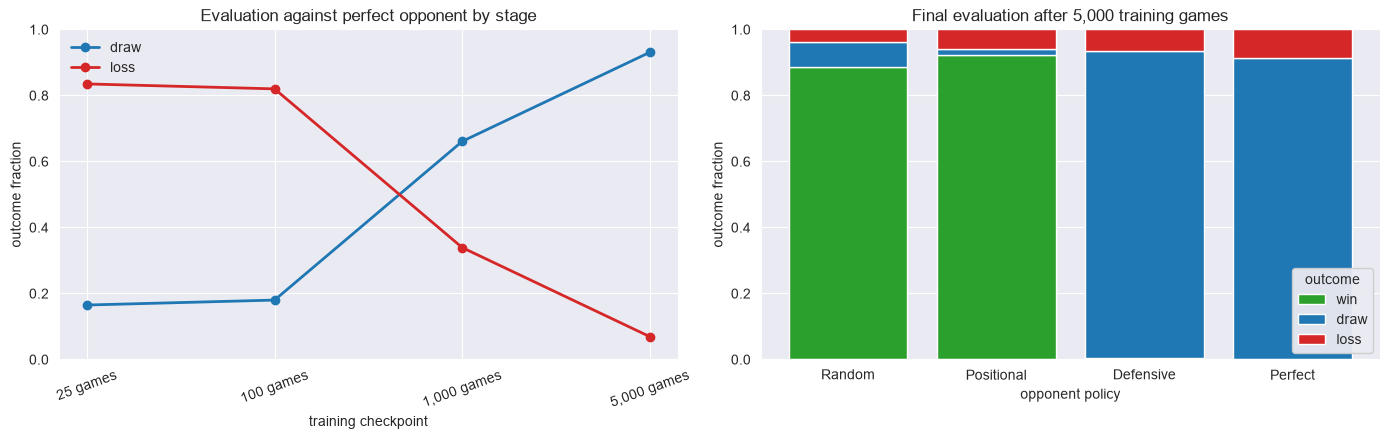
These plots serve two purposes. The training curves summarize the games MENACE experienced during self-play, while the evaluation plot checks the learned policy against a few fixed opponents. Against a perfect tic-tac-toe opponent, the best possible result is a draw, so the useful signal is whether losses disappear, not whether wins appear.
Learned State-Dependent Policies
In the bandit examples, there was only one state, so one action distribution was enough. In tic-tac-toe, the right move depends on the board. MENACE handles this with a separate policy for each tracked board state, represented by that state's matchbox and bead counts.
The next figure shows three states after 1,000 training games. At this point, the policy has started to favor some moves without assigning nearly all probability to one move, and the tactical matchboxes have been visited often enough to show meaningful preferences.
- the empty opening board,
- a state where $X$ can win immediately,
- a state where $X$ must block an immediate threat from $O$.
The first row shows bead counts; the second shows the action probabilities induced by those counts. For the opening board, we show only the symmetry-distinct moves, matching the physical matchbox.
# Visualize learned state-dependent policies at a training checkpoint.

# These tactical states are visited often enough during noisy pooled self-play
# for the learned bead counts to show clear policies.
take_win_board: Board = (-1, -1, 0, 0, 1, 0, 1, 1, -1)
must_block_board: Board = (-1, -1, 1, 0, 1, 0, -1, 1, 0)
policy_boards = [
    (opening_board, "Opening policy"),
    (take_win_board, "Take the win"),
    (must_block_board, "Must block"),
]

policy_checkpoint = 1_000
menace_at_policy_checkpoint = menace_checkpoints[policy_checkpoint]

fig, axes = plt.subplots(2, len(policy_boards), figsize=(4.3 * len(policy_boards), 8.2))
for column_index, (board, title) in enumerate(policy_boards):
    draw_matchbox_beads(
        axes[0, column_index],
        menace_at_policy_checkpoint,
        board,
        title=f"{title}: beads after {policy_checkpoint:,} games",
    )
    draw_policy_heatmap(
        axes[1, column_index],
        menace_at_policy_checkpoint,
        board,
        title=f"{title}: policy after {policy_checkpoint:,} games",
        highlight_max=True,
        spread_over_orbits=board != opening_board,
    )

fig.suptitle(f"State-dependent MENACE policies after {policy_checkpoint:,} training games", y=1.02)
plt.tight_layout()
display_figure(
    fig,
    alt_text="State-dependent MENACE policies after 1,000 games, showing bead counts and implied move probabilities for an opening, winning, and blocking board.",
)
#
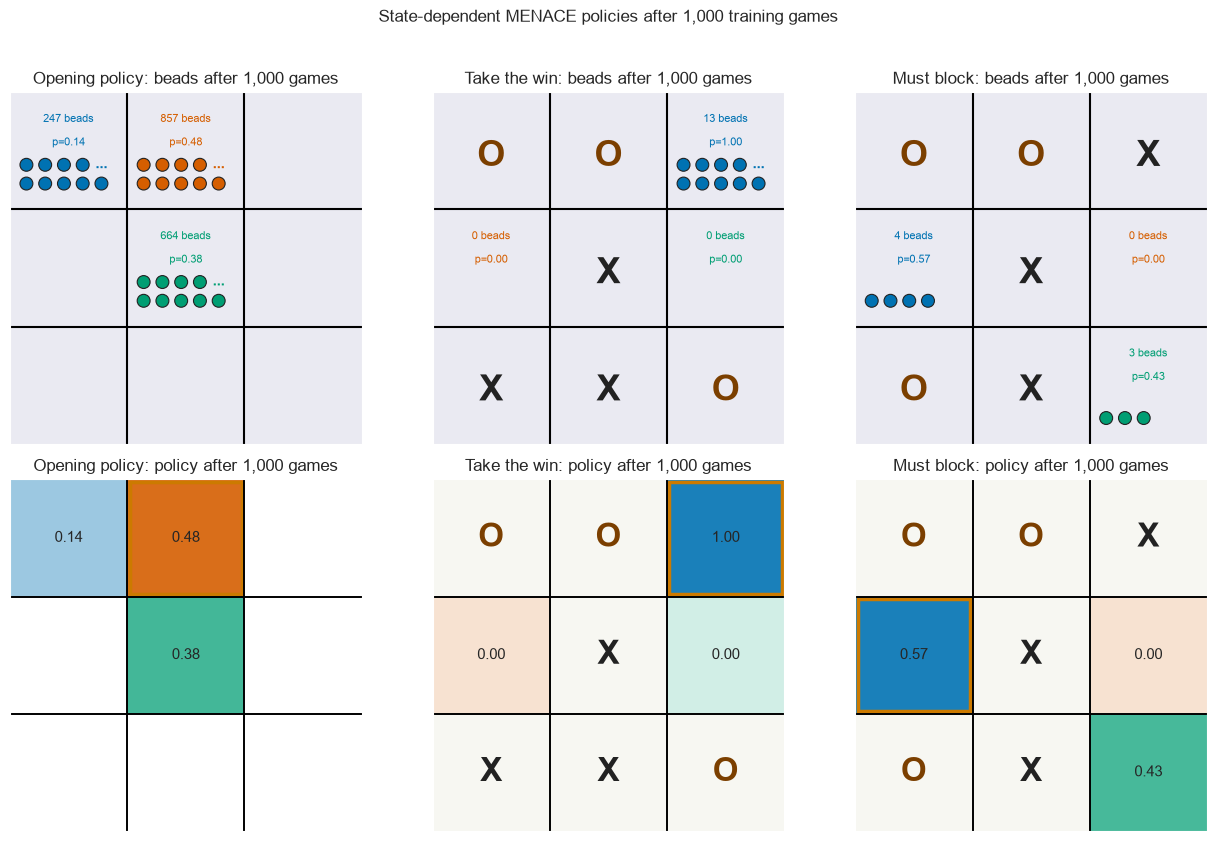
These plots play the same role for MENACE as the posterior and policy plots did in the previous post. There are no density curves here. The learned object is the policy itself, visible in the bead counts and in the action probabilities they imply.
How This Relates to Thompson Sampling
In the previous post in this series, Thompson sampling used posterior uncertainty about each action's expected reward to choose online. With independent posterior draws, the selected action is the one with the largest draw; equivalently, each action is selected in proportion to its posterior probability of being best.
MENACE takes a different approach. It is not a typical modern RL algorithm; we use it here for its illustrative value. It learns a policy directly, making that policy physical and intuitive: bead counts in a matchbox act as policy weights, and drawing a bead samples an action. MENACE therefore does not maintain a posterior over rewards or a separate value model.
The two approaches store different things, so their action probabilities have different meanings:
| Method | What is stored? | How is an action selected? | What do the probabilities mean? |
|---|---|---|---|
| Thompson sampling | posterior over action values | draw one value from each posterior and choose the largest | posterior probability that the action is best |
| MENACE | bead counts / policy weights | sample directly from the normalized bead counts | the learned tendency to choose each move |
Both methods produce stochastic actions, but the source of that randomness is different: posterior uncertainty in Thompson sampling, and directly learned policy weights in MENACE.
Play Against the Learned Policy
The plots above are static snapshots. The widget below freezes the trained opening-player MENACE after 5,000 games and lets you play against it.
You play O and MENACE plays X. On MENACE's turn, the colored squares show the move probabilities represented by its symmetry-reduced matchbox policy. If several legal squares are equivalent by rotation or reflection, the widget shows one representative square for that bead class. The vertical fill shows the class probability: taller fill means the class is more likely to be sampled. Click Sample MENACE move to draw one bead from the current matchbox and play the representative square for that class.
The widget is for inspection, not training. It does not add or remove beads while you play.
# Show a standalone browser-side app for playing against the trained MENACE policy.
# The interactive Bokeh widget lives in notebooks/from_ab_to_rl/menace_playable_app.py.
from menace_playable_app import show_playable_menace_app  # noqa: E402

show_playable_menace_app(training_menace)
#
Interactive visualization loading…
Summary
MENACE is a simple physical illustration of reinforcement learning that makes policy learning visible in tic-tac-toe:
- a board position is the state, with symmetry-equivalent positions sharing one tracked state,
- a legal move is an action,
- a matchbox stores the policy for one tracked board state as colored beads, where each bead color represents a legal move,
- bead-count proportions define the policy $\pi(a \mid s)$,
- one full game is called an episode,
- the final win/draw/loss outcome updates the beads selected during that episode.
The terminal learning signal arrives only at the end of the episode. MENACE uses that outcome to update every selected move, making delayed credit assignment physical.
MENACE learns the policy directly rather than a posterior over values or an environment model: more beads make a move more likely, while fewer beads make it less likely. That is the key step beyond bandits: a delayed game outcome shapes a state-dependent policy.
References
- Part 1: Bayesian A/B Testing, Peter Roelants: introduces fixed randomized experiments and posterior comparisons.
- Part 2: Bandits and Thompson Sampling, Peter Roelants: moves from online action selection to bandit feedback.
- Experiments on the Mechanization of Game-Learning, Donald Michie: the original source for MENACE and its matchbox game-learning setup.
- MENACE page, Matthew Scroggs: an accessible reference for MENACE mechanics, matchboxes, beads, and board symmetries.
Further Reading
- MENACE blog post, Matthew Scroggs: a reader-friendly historical and implementation companion to the MENACE page.
- Reinforcement Learning: An Introduction, Richard S. Sutton and Andrew G. Barto: this series only takes us to the edge of RL; this book is the deeper dive.
# Print package versions used to execute this notebook.
print(f"Python: {platform.python_version()}")
for package in ["numpy", "matplotlib", "seaborn"]:
    print(f"{package}: {importlib.metadata.version(package)}")
#
This post is generated from an IPython notebook file. Link to the full IPython notebook file